Exhibitions - The Garden of Forked Tongues
Miriam Ghani
The Garden of Forked Tongues
04.10.16 – 01.01.17
Organized on the occasion of the release of Rebecca Solnit and Joshua Jelly-Schapiro’s forthcoming New York City Atlas, Nonstop Metropolis, the Queens Museum’s Nonstop Metropolis: The Remix takes inspiration from the book’s maps and essays. The New York City Atlas is the third in Solnit’s series, following Infinite City: A San Francisco Atlas and in Unfathomable City: A New Orleans Atlas. With our very own, one-of-a-kind, 3-D map here at the Museum—the Panorama of the City of New York—as well as a deep commitment to the many issues Solnit raises in her books, the Queens Museum has commissioned two new projects by New York-based artists Duke Riley and Mariam Ghani in anticipation of the book’s launch at the Museum.
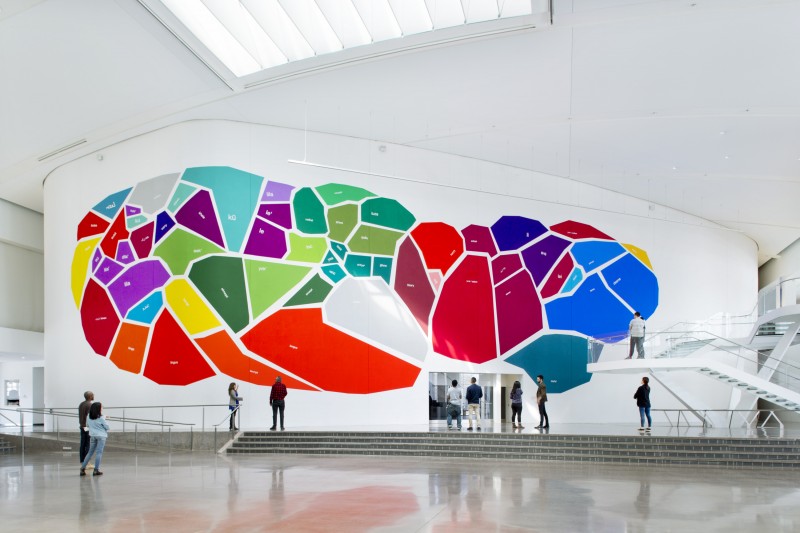
Each of the 59 polygons on the wall in Mariam Ghani’s The Garden of Forked Tongues represents an endangered language spoken in Queens—languages that are rapidly or slowly disappearing from the world, but which are still being spoken in our remarkably polyglot borough. The word that appears inside each polygon is the word for “tongue” in each language—a word which, in many languages, also means “language.”
The location of the languages on the wall corresponds to their distribution across different neighborhoods of Queens, with Astoria and Long Island City on the top left, Ridgewood on the bottom left, Far Rockaway on the bottom right, and Bayside on the top right. The color gradations show the relationships between different languages in the same language families. The size of each polygon is determined by three factors: the relative density of endangered languages spoken in that part of Queens; a calculation of the number of living speakers of that language left in the world, which ranges from as few as 5 to as many as 1.5 million; and the Ethnologue scarcity rating (a scale ranging from 1 to 10, with 10 being extinct). This scarcity rating takes into account factors beyond just the number of speakers, including whether a language is an official language, and is taught in schools, and whether it is actively being transmitted to younger generations.
The data used was collected largely by the Endangered Language Alliance, a group that records living speakers of endangered languages, and was visualized with both code and graphics software to create a customized graphic rendering.